Step 1
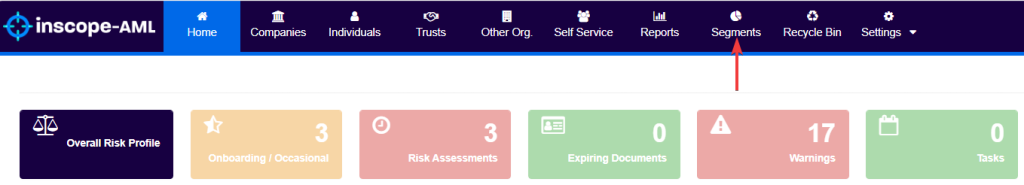
From the menu at the top of the screen, users should click on Segments.
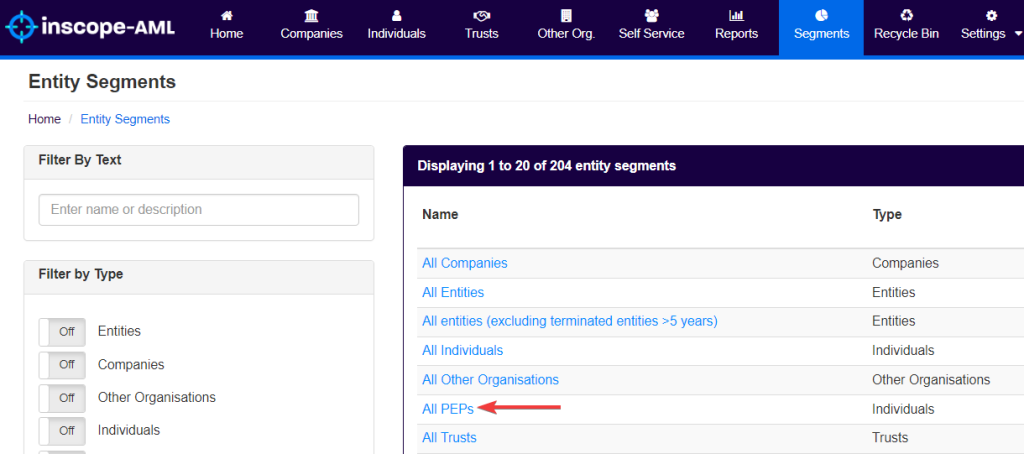
The system will then display a list of all the segments that are currently created within your system.
Step 2
Users can then search for and click on the segment they wish to view.
Step 3
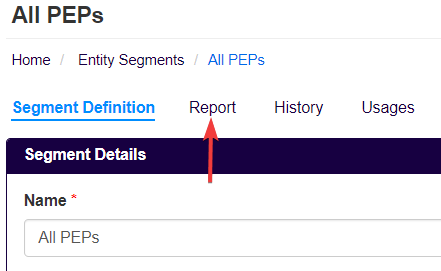
Within the segment itself, users should click on the Report tab.
Step 4
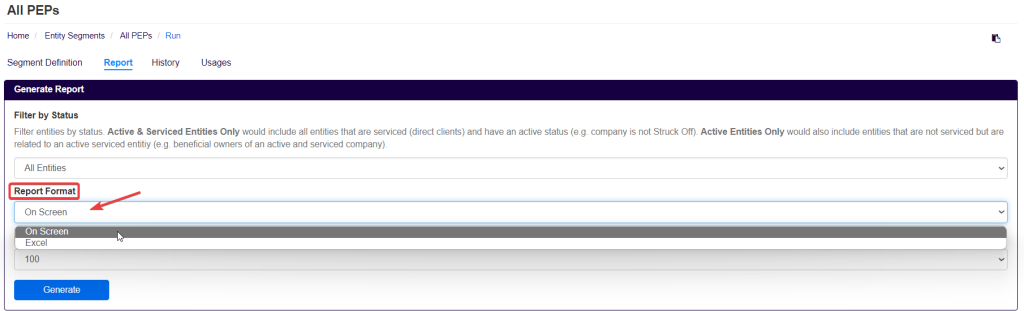
Users can filter by status between All Entities (all entities in the database including terminated clients, UBOs, directors, etc…), Active Entities Only (entities related to active/onboarding clients) and Active and Serviced Entities (entities that are direct clients).
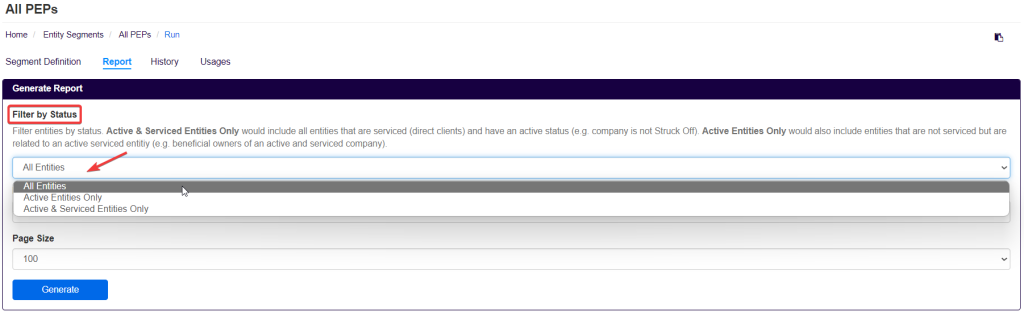
Users can also select the preferred report format either On Screen or Excel depending on where they would like to view the information.
This will generate a detailed list of all the entities within that segment, provide general information about that entity and also information related to any custom fields available to that entity.